Task III.B: Weather Information
- Lesson Overview
- Instructor Notes
- Lesson Details
- METAR
- TAF
- Surface analysis charts
- Radar summary chart
- Winds and temper aloft chart (FD)
- Significant weather prognostic charts
- Low level chart
- ASOS (Automated Surface Observing System)
- AWOS (Automated Weather Observing System)
- ATIS (Automated Terminal Information Service)
- Go/No-go decision
- External Rersources
- Conclusion
- ACS Requirements
Lesson Overview
- Objective
-
The student should develop knowledge of the elements related to weather information with the ability to interpret several weather sources and make a competent, well educated, Go/No Go decision. The student should also develop knowledge of the elements related to weather information, by analyzing weather reports, charts, and forecasts from various sources.
- Reference
-
-
Foreflight weather breifings
- Key Elements
-
-
Information sources
-
EFAS—122.0
-
Go/No Go decision
-
- Elements
-
-
METAR
-
TAF
-
Surface analysis chart
-
Radar summary chart
-
Winds and temperature aloft
-
Significant weather prognostic charts
-
Convective outlook chart
-
AWOS, ASOS, ATIS reports
-
Weather briefing
-
Weather information sources
-
In-flight weather advisories
-
Go/No-go decision
-
- Equipment
-
-
White board
-
Markers
-
References
-
- Schedule
-
-
Discuss objectives
-
Review material
-
Development
-
Conclusion
-
- Instructor Actions
-
-
Discuss lesson objectives
-
Present lecture
-
Questions
-
Homework
-
- Student Actions
-
-
Participate in discussion Take notes
-
- Completion Standards
-
The student can effectively interpret the necessary weather information, and has the ability to make a competent Go/No Go decision, based on the information.
Instructor Notes
- Attention
-
Instead of getting ourselves stuck, in the air, in a thunderstorm or some sort of extreme weather we should have a good understanding of weather information in order to know when to and not to fly.
- Overview
-
Review Objectives and Elements/Key ideas
- What
-
Through a complex system of weather services, government agencies, and independent weather observers, pilots are given vast information regarding weather patterns, trends, and characteristics in the form of up-to-date weather reports and forecasts.
- Why
-
These reports and forecasts enable pilots to make informed decisions regarding weather and flight safety.
Lesson Details
Weather, good or bad, impacts each and every flight. Having a solid understanding of weather, and how to obtain current/forecast weather information, is critical to every flight.
METAR
Aviation routine weather report—observation of current surface weather reported in a standard international format.
Although there is not enough time in this lesson to cover all aspects of Metar Encoding, here is a simple guide to helping understand how METARS work.
- METAR Codes
|
☑️
|
|
TAF
Terminal aerodrome forecast—report established for the 5SM radius around an airport. Valid for a 24-hr period, and updated four times a day (0000Z, 0600Z, 1200Z, 1800Z).
Utilizes the same descriptors and abbreviations as the METAR.
- TAF Codes
|
☑️
|
|
Surface analysis charts
Depicts an analysis of current surface weather. Transmitted every 3 hours, covers contiguous 48 states and adjacent areas. Shows areas of low/high pressure, fronts, temperatures, dewpoints, wind direction and speed, local weather, and visual obstructions.
Also depicts surface weather observations for reporting points across the US, each illustrated by a station model that includes:
-
Type of observation—round is official weather observer, square is automated station.
-
Sky cover—shown as clear, broken, overcast, or obscured/partially obscured.
-
Clouds—cloud types represented by specific symbols. Low cloud symbols placed beneath station model; middle and high cloud symbols placed directly above station model. Typically only one type of cloud depicted.
-
Seal level pressure—given in 3 digits to the nearest tenth of a millibar. For 1000 mbs or greater, prefix a 10 to the 3 digits; for less than 1000 mbs, prefix a 9 to the 3 digits.
-
Pressure change/tendency—in tenths of mbs over the past 3 hours, depicted directly below the sea level pressure.
-
Precipitation—precipitation that has fallen over the last 6 hours to the nearest hundredth of an inch.
-
Dewpoint—in degrees Fahrenheit.
-
Present weather—many different weather symbols used to describe the current weather.
-
Temperature—in degrees Fahrenheit.
-
Wind—true direction of wind, given by the wind pointer line, indicating the direction from the wind is coming. Short bar=5 knots, long bar=10 knots, pennant=50 knots.
Radar summary chart
Graphically depicted collection of radar weather reports. Display areas of precipitation and information regarding the characteristics of precipitation. Published hourly, at 35 minutes past the hour.
-
No information—if information is not reported, it will say “NA.” If no echoes are detected, it will say “NE.”
-
Precipitation intensity contours—described as one of six levels, shown by three contour intervals.
-
Height of tops—heights of echo tops given in hundreds of feet MSL.
-
Movement of cells—indicated by an arrow pointing in the direction of movement, speed in knots at the top of the arrow. “LM” indicates little movement.
-
Type of precipitation—marked using specific symbols (not those used on METAR).
-
Echo configuration—echoes shown as being areas, cells, or lines.
-
Weather watches—depicted by boxes outlined with heavy dashed lines.
Only depicts areas of precipitation — will not show areas of clouds and fog with no appreciable precipitation. Will not show the heights of tops and bases of clouds.
Depiction of current precipitation, should be considered with current METAR and weather forecasts.
Winds and temper aloft chart (FD)
Provides wind and temperature forecasts for specific locations. Forecasts made twice a day, 0000Z and 1200Z. Uses true altitudes through 18,000 ft and pressure altitudes above 18,000 ft.
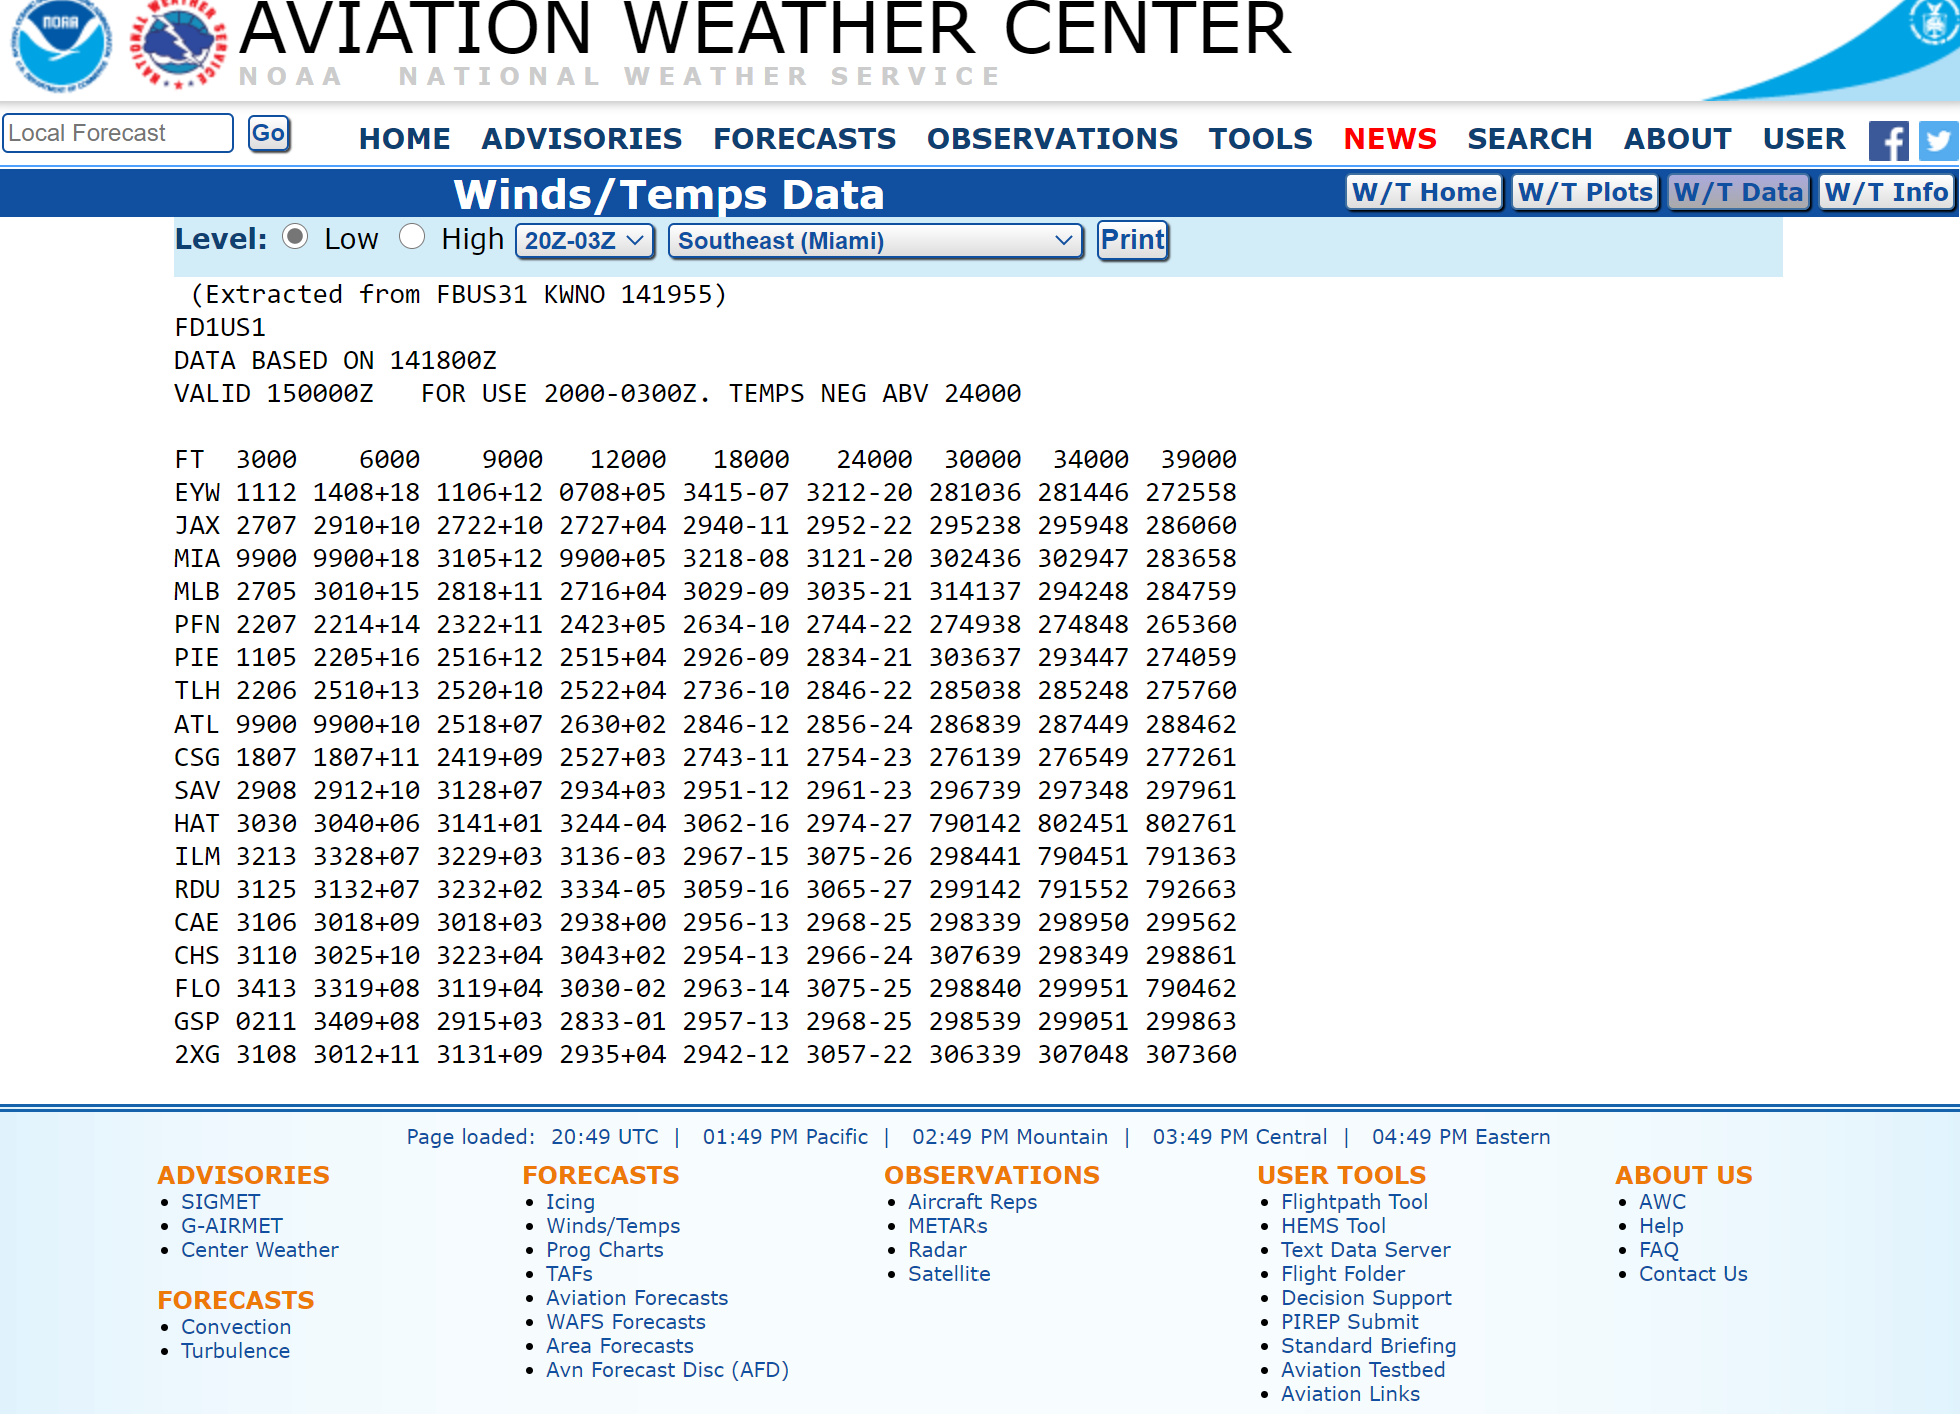
Wind direction is always in reference to true north—wind speed always given in knots. No winds are forecast when a given level is within 1,500 ft of station elevation.
Wind direction and wind speed listed together in four-digit code:
-
First two digits indicate direction the wind is blowing from in tens of degrees.
-
Second two digits indicate the speed of the wind.
If windspeed is forecast to be greater than 100 knots but less than 199 knots, 50 is added to direction, and 100 is subtracted from the speed. Do the reverse to decode. If windspeed is forecast to be 200 knots or greater, the wind group is coded as 99 knots. Light and variable wind is coded as “9900.”
Temperature is always given in degrees Celsius. No temperatures are forecast for a level within 2,500 ft of station elevation. Temperatures above 24,000 ft MSL are always negative.
Significant weather prognostic charts
Portray forecasts of selected weather conditions at specified valid times. Forecasts made from a comprehensive set of observed weather conditions that are extended forward in time and become forecasts by considering atmospheric and environmental processes.
Forecast made for various periods of time—each valid time is the time at which the forecast conditions are expected to occur, and is printed on the lower left corner of each panel. Issued four times a day, at 0000Z, 0600Z, 1200Z, and 1800Z. 12-hour prog—forecast of conditions with a valid time 12 hours after the observed time.
Altitude information referenced to MSL. True altitude below 18,000’, pressure altitude above 18,000’.
Prog charts generated for two general time periods. Day 1 progs are forecast for the first 24-hour period and are prepared for 2 altitude references. Day 2 progs are forecast for the second 24-hour period. Charts available for low-level significant weather and high-level significant weather.
Low level chart
Day 1 forecast of significant weather for the conterminous US. Weather information for layer from surface to FL240 (400 mbs). Information provided for two forecast periods: 12 hours and 24 hours. Provides overview of selected flying weather conditions up to 24,000 ft. We can use surface pressure patterns to infer surface winds. We can infer structural icing in areas with clouds and precipitation above freezing levels, and in areas of freezing precipitation.
Four panels:
-
Upper two panels depict 12- and 24-hr significant weather progs Display forecast weather flying categories (VFR, IFR, MVFR), freezing levels, and turbulence
-
Lower two panels depict 12- and 24-hr surface progs
Display forecast positions and characteristics of pressure systems, fronts, precipitation. Arrow indicates direction of movement of pressure center; speed in knots. Outline for areas of forecast precipitation and thunderstorms—shaded areas of precipitation indicate at least ½ the area is affected by the precipitation, and unique symbols indicate the type of precipitation.
36- and 48-hr surface prog
Day 2 forecast of general weather—extension of day 1 low-level prog chart, issued from same observed data base. Issued two times daily (0000Z and 1200Z), charts valid 36/48hrs after observation.
Two panels (36- and 48-hr surface progs) and a forecast discussion. The panels display forecast positions/characteristics of pressure patterns, fronts, and precipitation. Forecast discussion is a discussion of day 1 and day 2 forecast package—identifies weather systems and associated weather conditions portrayed on prog charts.
Use for general weather conditions outlook and to assess the progression of weather through Day 2.
High-level significant weather prog
Day 1 forecast of significant weather covering a large portion of the Northern Hemisphere and a limited portion of the Southern Hemisphere for 24,000 to 60,000 ft. Conditions routinely appearing above the jet streams with cumulonimbus clouds, turbulence, tropopause heights, surface front information.
Tropical cyclones, squall lines, eruptions, sandstorms, dust storms. Issued 4 times a day, valid time 00Z, 06Z, 12Z, 18Z.
Convective Outlook Chart
Flight planning tool used to determine forecast areas of thunderstorms. Outlines general thunderstorms and provides risk areas. Two panels—Day 1 (left) and Day 2 (right) convective outlook. Day 1 issued 5 times daily (first issuance at 0600Z, then 1300Z, 1630Z, 2000Z, and 0100Z) all valid until 12Z the next day.
-
Day 2 issued 2 times daily (first issuance at 0830Z during standard time, 0730Z during daylight time, updated at 1730Z), valid from 12Z the following day to 12Z the next day. Risk levels depend on number of severe thunderstorm reports per geographical unit and forecaster confidence
-
SEE TEXT used for situations where slight risk is considered but not warranted at the time of forecast
-
SLGT describes a high probability of 5-29 reports of >1`" hail and/or 3-5 tornadoes, and/or 5-29 wind events. Well-organized severe thunderstorms expected but in small numbers and low coverage.
-
MDT describes a high probability of at least 30 reports of >1`" hail, 6-19 tornadoes, or numerous wind events. Greater concentration of severe thunderstorms and greater wind magnitude.
-
HIGH describes a high probability of at least 20 tornadoes (at least two of them rated F3 or higher) or an extreme derecho causing widespread (> 50) wind events with higher-end winds (> 80 mph) and structure damage reports. A major weather outbreak is expected with great coverage.
ASOS (Automated Surface Observing System)
Continuous minute by minute observations that are used to generate a METAR and provide information. Transmits SPECI report whenever it detects a significant change in conditions.
Contains
-
Cloud height indicator
-
Visibility sensor
-
Precipitation identification sensor
-
Freezing rain sensor (at select sites)
-
Designated A01 without liquid/frozen precipitation discriminator, A02 with
-
-
Pressure sensors
-
Ambient temperature and dew point temperature sensors
-
Anemometer for wind direction and speed
-
Rainfall accumulation sensor
-
Lightning detection equipment installed at selected sites
Cannot distinguish between stratus/cumulonimbus clouds. Limited ability to identify visibility restrictions (prevailing, sector, tower visibility) without input from human observer.
-
Level A: highest level of service, available at major airports
-
Level B: has human observers available 24hrs
-
Level C: at airports with part-time towers (human augmentation ends when tower closes)
-
Level D: at smaller, non-towered airports (unattended, always AUTO when in METAR)
AWOS (Automated Weather Observing System)
First widely installed automated weather data gathering system at airports. Available in lesser configurations.
-
AWOS-A: Only reports altimeter setting
-
AWOS-1: Measures and reports wind speed, direction, gusts, temperature, and dew point
-
AWOS-2: Visibility information
-
AWOS-3: Cloud/ceiling data (essentially equivalent to ASOS); may include precipitation discriminators and lightning detection.
Difference between ASOS and AWOS—the ability to detect and report significant changes in surface weather. AWOS transmits three reports per hour at fixed intervals and cannot issue a special report as needed.
ATIS (Automated Terminal Information Service)
Continuous broadcast of recorded non-control information in busier terminal areas. Contains essential information such as weather and active runways and approaches. It is given a letter designation and is updated when there is a significant change.
Re-recorded at every update. Data may be entered by hand, from a METAR, or directly from the sensors. Modern systems are fully automated.
Arriving/departing aircraft ATIS may be on separate frequencies.
Go/No-go decision
The go/no go decision includes a number of possible factors, with one significant component being the weather. The decision must be made as to whether the pilot can handle the aircraft and conditions expected to be encountered during the flight. Certain conditions may warrant an automatic no-go decision. These might include the following.
-
Thunderstorms of any kind, especially embedded
-
Fast-moving fronts or squall lines
-
Moderate or greater turbulence
-
Icing
-
Fog, or other visual obscuration
-
In addition to weather other factors can drive a go/no-go decision. The physical and mental condition of the pilot is important. If the pilot is sick, depressed, upset, or tired those conditions may affect the pilot’s ability to handle the demands of the flight. Use the IMSAFE checklist to help evaluate.
Evaluate the pilot’s recent flight experience, as well. Don’t go beyond the pilot’s or the aircraft’s current capabilities. For instance, is the pilot comfortable dealing with MVFR conditions if they haven not flown in some time?
Flying is a continual decision making process throughout any flight. Weather and other circumstances evolve with time, so divert or discontinue a flight enroute if conditions warrant.
External Rersources
Conclusion
It is very important to be able to interpret and make a Go/No Go decision based on the information attained. A safe flight begins with a thorough weather briefing to ensure the pilot understands the meteorological factors that may affect the flight.
ACS Requirements
To determine that the applicant exhibits instructional knowledge of the elements related to weather information by describing:
-
Importance of a thorough preflight weather briefing.
-
Various means and sources of obtaining weather information.
-
Use of real-time weather reports, forecasts, and charts for developing scenario-based training.
-
In-flight weather advisories.
-
Recognition of aviation weather hazards to include wind shear.
-
Factors to be considered in making a “go/no-go” decision.